
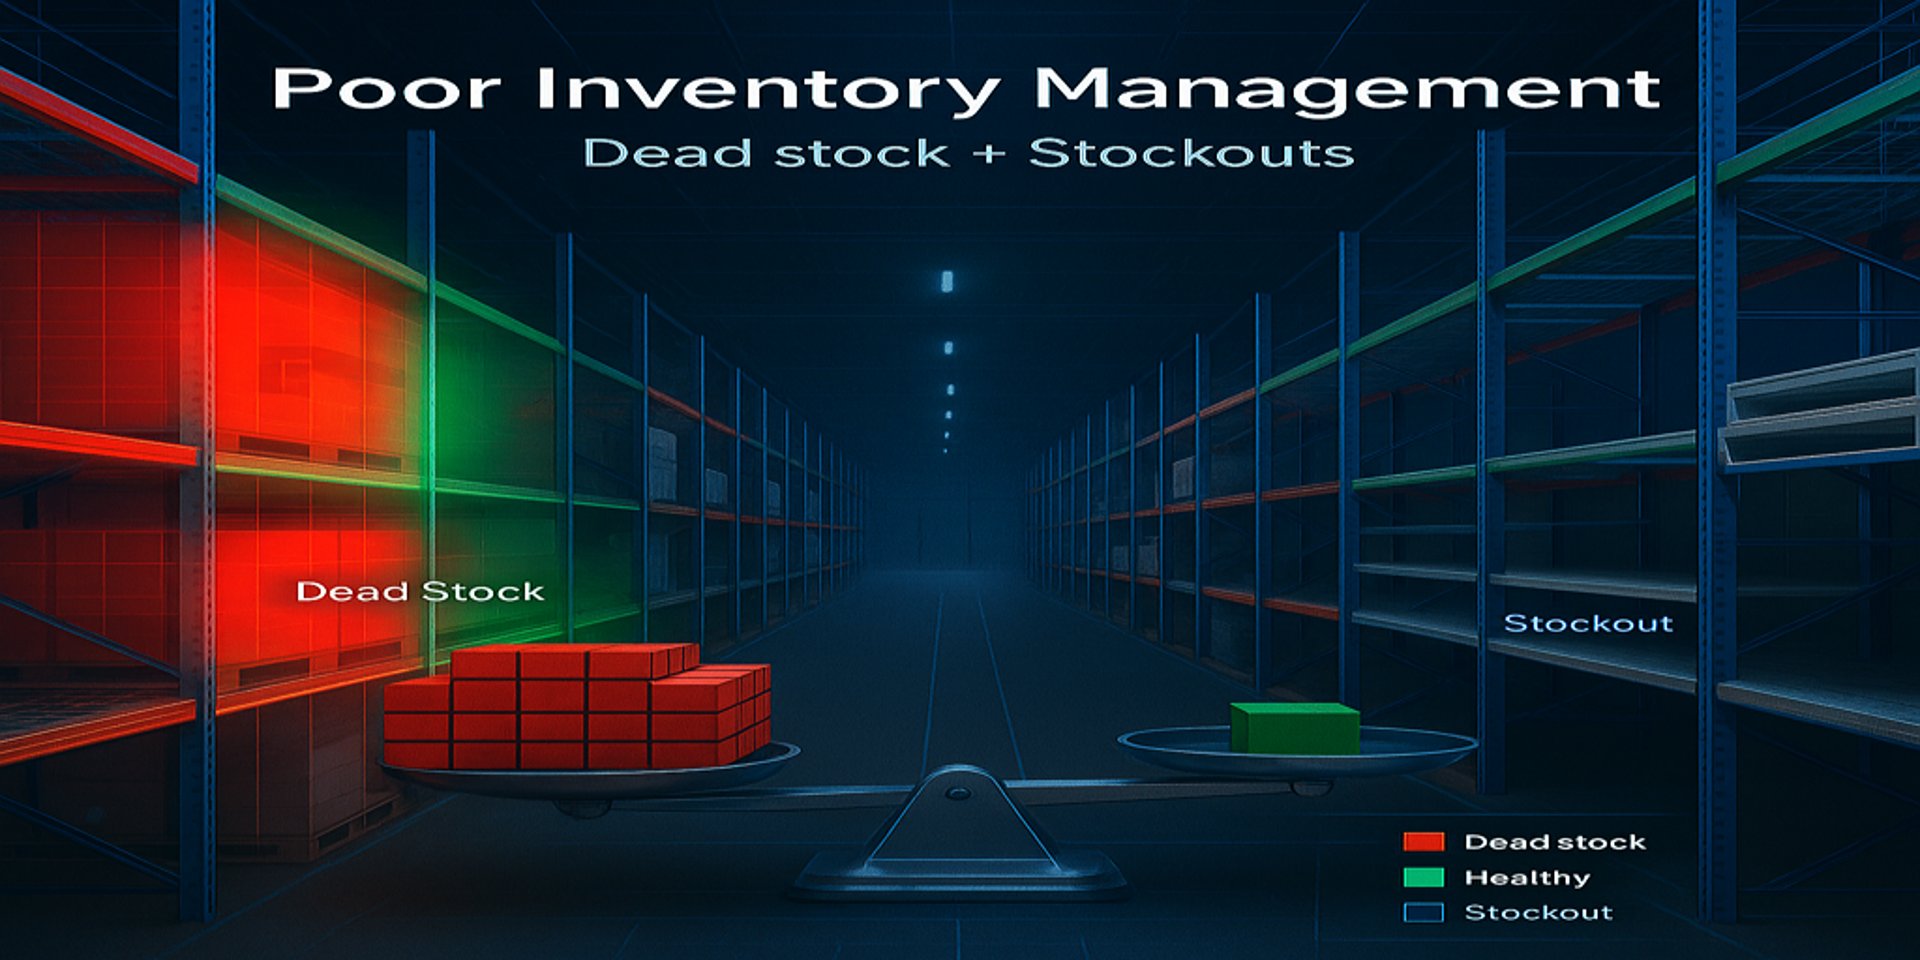
Poor Inventory Management and how to solve it
Poor inventory management is a common failure pattern that traps cash, delays deliveries, and erodes margins. From rising DIO to SKU sprawl, the warning signs are clear. Learn the steps to reset—segment SKUs, fix safety stock, cut MOQs—and turn inventory into a cash-protecting system.
BUSINESS FAILURE ANALYSIS
9/13/20256 min read
Businesses experience failure through poor inventory management but you can prevent this by following certain steps:
The first sign of business failure emerges from inventory management problems which need immediate correction
Businesses do not experience collapse because they experience gradual deterioration. They drip-fail. The first sign of these problems emerges from inventory management. The warehouse contains plenty of stock yet customers receive continuous out-of-stock notifications. The business experiences cash shortages during periods of normal financial performance. Premium freight becomes normal. Leadership points to demand fluctuations and supply chain problems as the cause of issues. The actual source of problems exists within your organization because of inadequate inventory management practices.
I have observed this pattern throughout manufacturing facilities and construction sites throughout KSA and throughout the GCC region. The business grows according to records yet the warehouse becomes overwhelmed with unnecessary stock items because teams increase SKUs for winning tenders and maintain excessive safety stock and accept supplier minimum order quantities. The business appears to expand through documentation but the warehouse operations face an overwhelming amount of inappropriate stock.
The decline of a business occurs through three main factors which affect cash flow and increase costs and damage customer relationships
The first sign of inventory problems appears on financial statements through increasing Days Inventory Outstanding. The cash conversion cycle extends its duration. The CFO now spends more time with banks than with sales personnel. The P&L begins to experience continuous losses. The combination of short production runs and equipment changes leads to higher production expenses. The company starts to incur costs from obsolete inventory. The customer experiences two main problems which stem from poor service delivery and delayed product shipments.
The current market volatility together with the bullwhip effect intensifies the impact on your upstream suppliers. The system expands when order fluctuations lead suppliers to maintain safety stock which results in increased system size. The warning about bullwhip effects has been evident since 2022 so businesses should develop strategies to handle this phenomenon. External: MIT Sloan Management Review — Prepare for the Bullwhip’s Sting.
The improvement of Saudi logistics performance does not eliminate the need for larger reorder points because supplier and lane variability require this adjustment when using gut-based management. Data analysis replaces the outdated practice of using "days-cover folklore" to prevent this issue. The World Bank provides LPI benchmarks which serve as reference points. World Bank — Logistics Performance Index 2023 (Saudi Arabia scorecard)
A KSA fabrication shop with an MRO distribution arm pursued multiple large-scale project requests for supply. The number of stock-keeping units (SKUs) expanded from 18,000 to 27,000. The DIO metric increased from 52 days to 71 days during the first half of the year. The delivery performance rate decreased to 88%. The company recorded 2.1% of its sales as write-offs. The sales team pointed fingers at suppliers but operational staff shifted the blame to sales personnel. The company implemented three changes which included SKU segmentation into A/B/C categories with service level targets and statistical safety stock calculation instead of "30 days cover" and MOQ renegotiation with the top 40 suppliers. The company achieved a DIO of 58 and OTIF (On-Time, In-Full) reached 96% while premium freight expenses decreased by 60% after two quarters. Same team. Different rules.
The actual reasons behind these problems run deeper than the given explanations
The lack of segmentation between different inventory items prevents proper management. The service level for A-items requires strict control and regular assessment yet C-items qualify for project-based or made-to-order purchasing.
The current safety stock system operates with unchanging parameters. The practice of using "30 days" as a safety strategy does not work. The calculation of safety stock must depend on both demand patterns and lead-time fluctuations instead of following established practices.
The implementation of supplier terms occurs without any adjustments. Your warehouse stores excessive inventory because of high MOQs from suppliers.
The accumulation of incorrect master data creates problems for planners who must work with incomplete information. The use of incorrect packaging dimensions and delivery times forces planners to make unguided predictions.
The absence of price fences enables customers to place small orders and request expedited delivery and engineering-specific products at standard prices which damages profit margins.
The five-metric focus test (run it this week)
1. DIO = (Average Inventory ÷ COGS) × 365
The reduction of inventory levels by 10–20% will become achievable after two quarters of implementation.
2. Coverage (days on hand) = On-hand ÷ Average Daily Demand
The target range for A-items should be between 20–40 days while B/C items should follow their designated service levels.
3. Service Level = OTIF lines ÷ Total lines
The service level for A-items should reach at least 95% performance.
4. Inventory Accuracy = (1 − |book − physical| ÷ book) × 100
Daily cycle counts should achieve inventory accuracy levels above 98% to meet the target.
5. Slow-Moving Ratio = Value >120 days cover ÷ Total value
The target ratio should be below 10% but exceed 20% to trigger a red alert.
Two or more metrics outside their targets indicate your organization follows a failure pattern instead of experiencing a temporary issue
The path to achieving good results requires designing a system instead of trying to work more.
The first step in inventory management requires dividing stock into two categories based on value and importance. Service levels should correspond to the different classes of inventory.
The system should use statistical safety stock calculations which adjust to changing lead times instead of following traditional "to be safe" methods.
The following steps should be taken to renegotiate minimum order quantities with major suppliers while implementing vendor-managed inventory or consignment programs for essential items.
The last 20-30% of products should be eliminated while converting rare items into made-to-order products.
The system should perform cycle counting and slotting operations to maintain inventory accuracy at 98% or higher.
The implementation of price fences through MOQ fees and expedite premiums and engineering surcharges will create revenue from variable costs.
The process should start immediately. The released inventory funds will enable your transformation while demonstrating your ability to execute fast changes. McKinsey — Gain transformation momentum early by optimizing working capital
The following actions need to be completed within the next 14 days
A new SKU freeze policy requires CFO and COO approval for all new items while each SKU needs a one-page passport that includes demand source and owner information and exit criteria.
The daily Inventory Control Tower must be established to monitor OTIF performance and track backorders and DIO and slow-moving percentages and expedite rates.
The safety stock calculation for A/B items should transition from days-cover to service-level-based methods.
The company should work with its top 30 suppliers to achieve MOQ reductions of 15-30% or establish vendor-managed inventory programs.
The company should disclose price fences to customers while enforcing these rules through strict enforcement.
No quote will be provided when price fences are not enforced.
The following KPIs require measurement instructions for tracking purposes
The DIO calculation requires dividing Average Inventory by COGS then multiplying by 365 while using weekly data to prevent month-end inventory spikes.
The calculation of coverage requires dividing on-hand inventory by average daily demand while using family-based measurements and monthly lead time updates.
The service level measurement requires tracking on-time and in-full line delivery rates against total lines while using customer-promised dates instead of shipping dates.
The inventory accuracy calculation uses the formula (1 − |book − physical| ÷ book) × 100 to evaluate daily cycle counts against annual wall-to-wall counts.
The slow-moving ratio calculation divides inventory value with more than 120 days of coverage by total inventory value while establishing disposal and auction protocols at 90 and 120 and 180 days.
A basic performance metric exists to maintain your integrity
The inventory performance indicators show green when DIO equals or falls below industry standards and OTIF reaches 95% and slow-moving items make up less than 10% and write-offs remain below 1% of sales.
The inventory performance indicators show amber when DIO increases by 10-20% annually and OTIF reaches 90-94% and slow-moving items represent 10-20% of total inventory and write-offs range from 1-1.5% of sales.
The inventory performance indicators show red when DIO increases by 20% annually and OTIF falls below 90% and slow-moving items exceed 20% and write-offs exceed 1.5% and free cash flow becomes negative.
The GCC region requires data-driven decision making instead of depending on traditional beliefs
The logistics infrastructure of the region continues to improve but supply chain lanes and suppliers maintain different levels of variability. A designed inventory system outperforms habit because it addresses the specific needs of your operations. The system depends on segmentation methods and mathematical buffer calculations and proper governance structures. Your organization will achieve three benefits from this approach: cash protection and service enhancement and reduced workload for your personnel. The benefits of this approach become evident through improved inventory management which starts showing results within one quarter by eliminating unneeded purchases and enabling the distribution of essential items.
The control-tower dashboard displays DIO trend data and OTIF performance and slow-moving ratio statistics for each family.
Key Takeaways
Your inventory can become a protective barrier instead of a financial burden. Schedule a Working Capital & Inventory Diagnostic with 3MsBC to transform your inventory management. Our 12-week program will reset your safety stock approach and secure better MOQ deals while freeing up capital without impacting your service quality.
https://www.3msbusiness.com/cash-burn-diagnostics-find-quantify-and-fix-the-leaks
https://www.3msbusiness.com/blog-post
https://www.3msbusiness.com/business-comebacks-turnaround-tales
Consulting
Empowering businesses through strategic consulting solutions.
Growth
Success
© 2025. All rights reserved.